Biological/Electronic Equivalence
This model relies on a basic equivalence between a biological membrane plus embedded ion channels, and an electronic circuit.
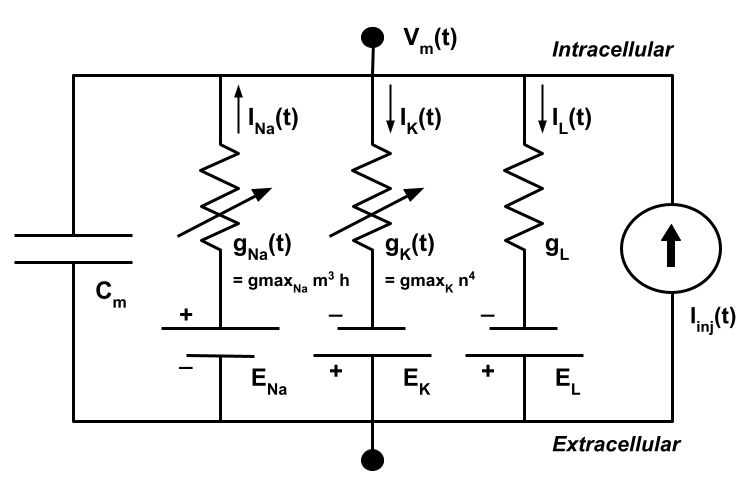
The circuit can be described by the diagram below, which is an electronic diagram representing a patch of cellular membrane.
The Circuit
The membrane capacitance ( Cm ) is taken to be a fixed property of the membrane.
Parallel to Cm are two “battery-capacitor” series; one for each of voltage-gated and leak ion channels.
Each of these ion pathways are modeled as the product of the ion’s conductance ( g ) and its driving electrochemical gradient ( E ), both of which may vary over time (except in the case of gL ; see below).
Ip represents the active movement of ions provided by ion transporters.
The net result of all of this activity in the cell membrane is a current across the membrane (i.e. from intracellular medium to extracellular medium, or vice versa).
Modeling voltage-gating versus leak:
The conductances of voltage-gated and leak channels, gn and gL respectively, are modeled differently. Since the gating of voltage-gated ion channels depends on the membrane potential at a given moment, it is non-linear. In contrast, leak ion channels are always in the same state, so their conductance is modeled linearly.
The Math
Lipid bilayer current

The current across the cell’s lipid bilayer ( Ic ) is the product of the membrane’s capacitance ( Cm ) and the rate of change of membrane potential ( Vm ) with respect to time ( t ).
Ion channel current

The current through a given ion channel ( Ii ) is the product of that channel’s conductance ( gi ) and the difference Vm - Vi
Vi is the ion species’ reversal potential. Notice that when Vm is equal to Vi the product becomes zero, and there is no net flow ( Ii ) for the ion, which is what defines reversal potential.
Combining these currents

If we sum the lipid bilayer current with ion channel currents for each ion species, we end up with a total current ( I ) for the patch of cellular membrane.
In the equation above, voltage-gated potassium ( K ) and sodium ( Na ) channels, as well as leak channels ( L ) are considered, leading to three instances of the ion channel current calculations.
Adding in activation parameters
Since the ion channels denoted in the equation above are in various states, some new variables must be added to the equation. Namely, activation and inactivation parameters are now included in each ion channel current calculation.

The new notation for each conductance variable (g) is the maximal conductance for that ion channel type. This, combined with the activation/inactivation parameters n, m and h, still represents the level of conductance for an ion channel, but with parameters that modify this conductance.
m is the activation parameter for sodium ( Na ) channels
h is the inactivation parameter for sodium channels
n is the activation parameter for potassium ( K ) channels
Plots
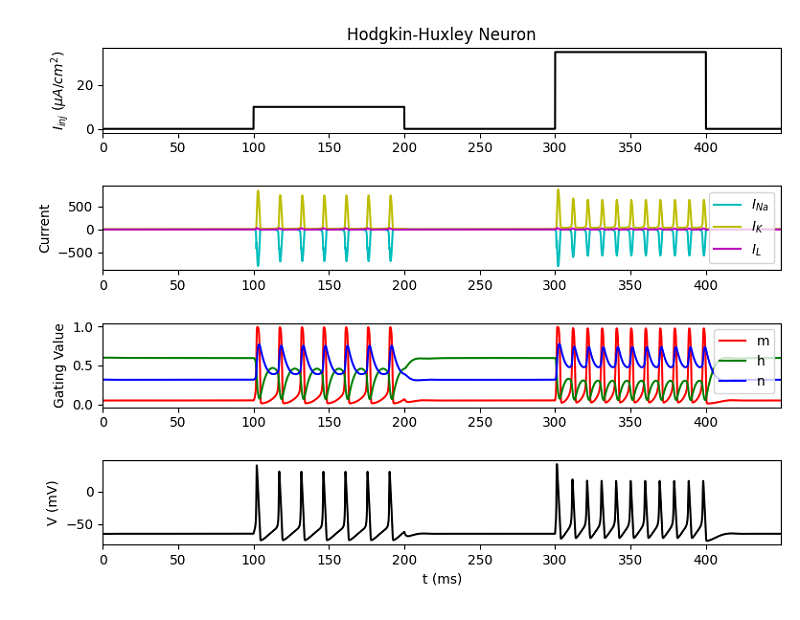
The plots generated by running the HodgkinHuxley.py script bundled with this tutorial are show below.
Description of each plot
Starting from the bottom, the first (bottom-most) plot shows neural membrane voltage activity. The spikes here are called “action potentials” and correspond directly to the current/time plot. Outflux of Na directly followed by influx of K causes the spiking activity observed in the plot.
The second plot from the bottom (let’s call this the gating plot) shows the activation/inactivation parameters of the ion channels in the neuron. The precise meanings of the three lines labeled m, h and n are described above, but it is sufficient to say that these parameters are proportional to the “amount” of gating for their respective ion channels. In other words, the amount of influence of each parameter on internal dynamics is given proportional to its full possible influence. So a gating value of 1 is at its maximal influence, and zero is no influence at all.
The third plot from the bottom (the current/time plot) makes this more concrete, showing the influx (negative y-axis) and outflux (positive y-axis) of ions passing through each type of ion channel being modeled. Notice that, in the gating plot, at times when m is large and h is small for a moment (say, just after 100ms), the sodium current (Ina) spikes outward. Notice also that the potassium current (Ik) spikes inward when its activation parameter n spikes in the gating plot.
Finally, consider the top plot, which shows two currents injected into the cell membrane at times 100ms and 300ms. Notice that the second injected current is significantly larger in magnitude than the first.
Relationship between the plots
Notice that the first set of action potentials (from about 100 to 200ms) is sparse compared to the second set (from 300 to 400ms). This is due to the increased current applied across the membrane in the second injection (see the bottom plot).
It is possible to see how intracellular and cell-patch dynamics are related through these four plots. Gating parameters affect ion channel conductance, which directly influences ion flow, which in turn controls electric potential across the membrane.
Terms
- Ion channel
Protein embedded in cellular membrane allowing passive flow of ions, depending on its configuration.
- Ion channel conductance
The rate of flow of ions through an ion channel. Directly affects membrane conductance, and changes with gating behaviour of an ion channel.
- Ion transporter
Protein embedded in cellular membrane that moves ions actively
- Membrane conductance
Total membrane conductance is the rate at which current (i.e. ions) can flow through the membrane, and is a result of the configuration of ion channels at a given moment.
- Membrane potential
The difference in electric potential between the exterior and interior of a cell.
- Nernst potential
See “Reversal potential”.
- Reversal potential
The membrane potential at which a given ion species has no overall flow across the membrane (i.e. the ion flow direction “reverses”).