Current-voltage characteristic
The current through an electronic component, with the corresponding potential difference (voltage) across it is called the current-voltage characteristic.
This relationship is usually represented with an I/V curve, which is just that: a plot of current versus voltage.
This property is one characteristic used to when examining the behaviour of electonic circuits. Given the electronic-biological equivalence discussed earlier, it is easy to see how this property would also be useful in defining the behaviour of excitable membranes and their embedded ion channels.
The patch-clamp protocol
In a patch-clamp experiment, a piece of membrane is sealed off from its surrounding environment, such that there is almost no influence of external electrochemical process on what is happening in this small “patch” of membrane.
By applying a voltage through this membrane patch, almost perfect control of the membrane potential can be obtained. In this way, an experimenter can hold the membrane at various voltages (fig. 1) and observe the current response that occurs (fig. 2).
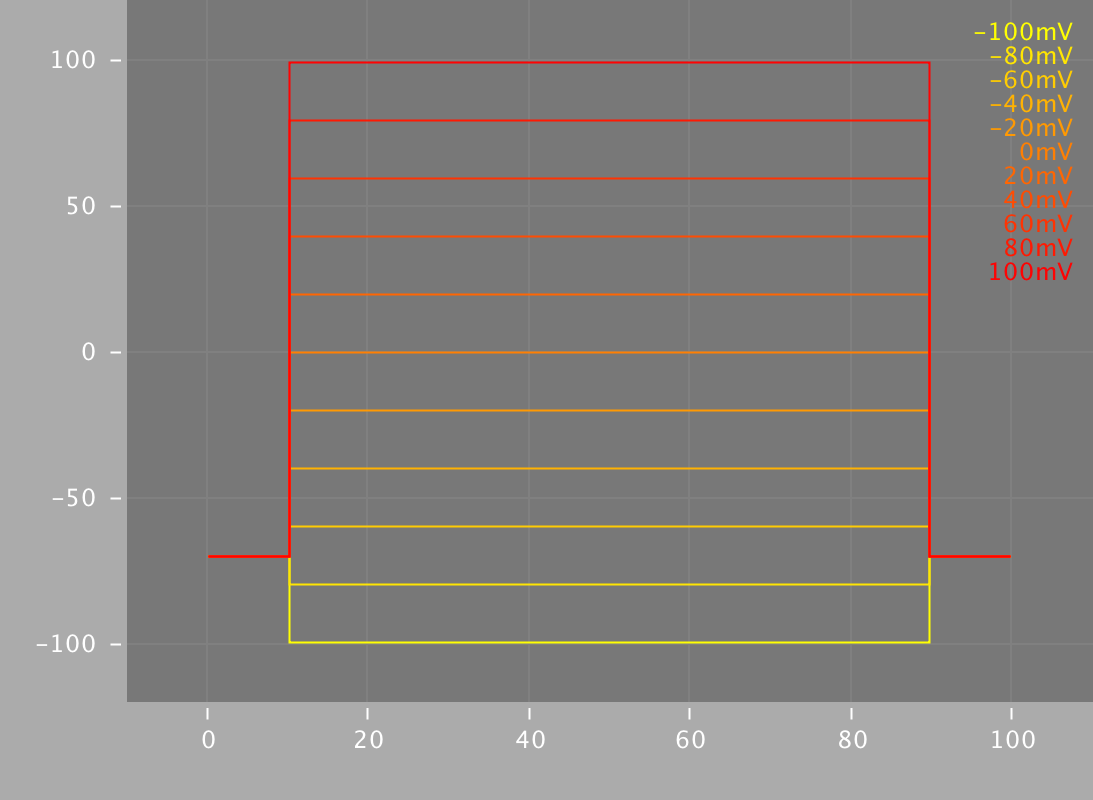
Fig. 1
Voltage stepping in a patch-clamp protocol. Electrical potential applied across a patch of membrane, holding the membrane at that potential.
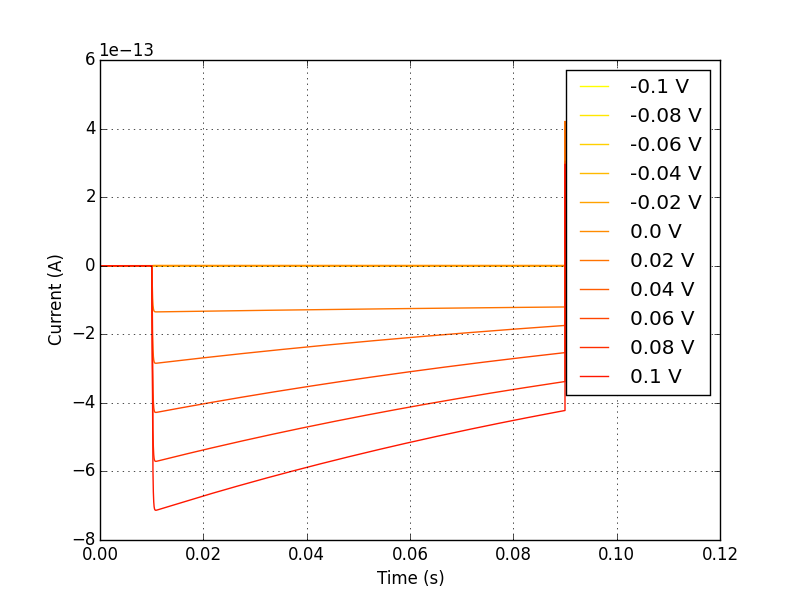
Fig. 2
Current-time plot for a voltage-clamped membrane patch. This represents the current change over time in response to voltage clamping.
Making I/V plots
With this data, we can now plot a current-voltage relationship, to help us characterize and model the electrophysiological behaviour of the patch of membrane.
We will consider two types of I/V curves here. The first is the so-called “peak” I/V curve, where the largest current magnitude produced at each voltage step is plotted against the voltage that produced it. We can see an example of this in figure 3.
The second type of I/V curve is called a “steady-state” I/V curve, and is a representation of the somewhat leveled out current at the end of each voltage step, again plotted against the voltage step that produced it. See figure 4 for an example of this type of I/V plot.
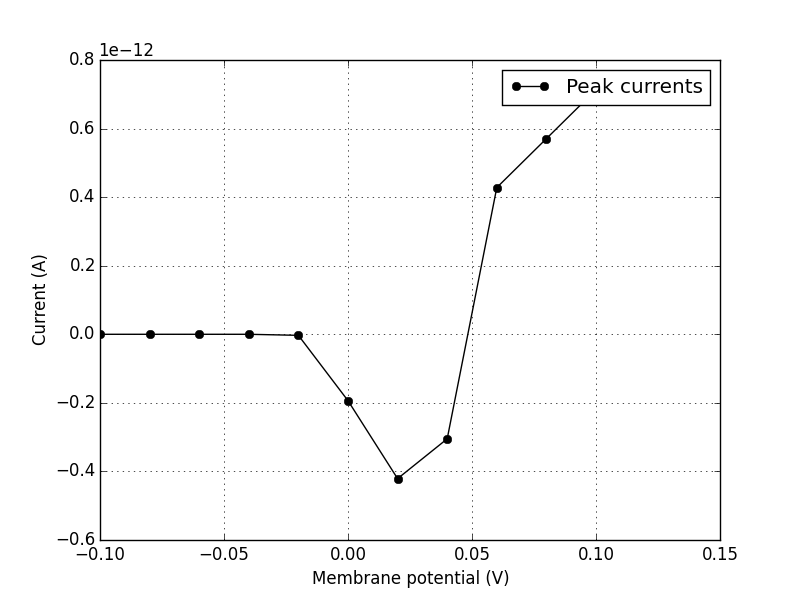
Fig. 3
Peak I/V Curve. Plotting the maximum current at each voltage step produces a curve like this.
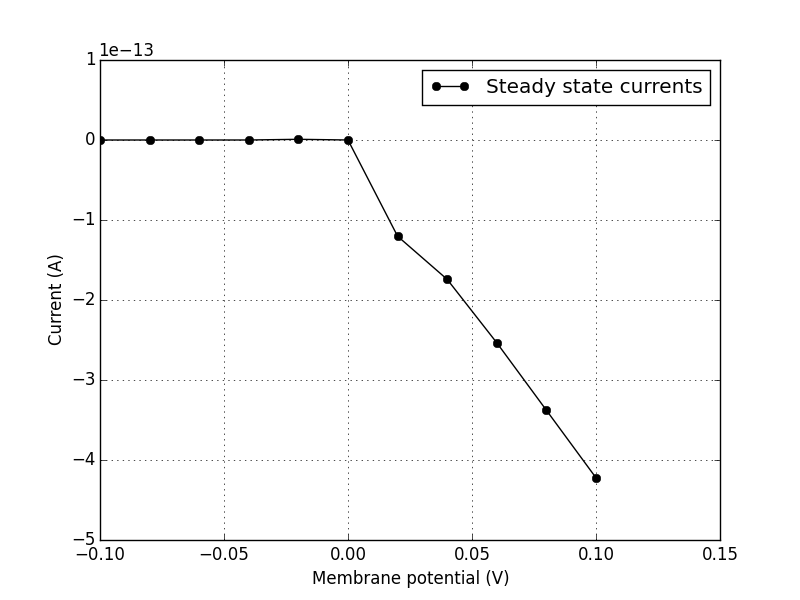
Fig. 4
Steady-state I/V curve. Plotting the current at the end of each voltage step gives us a curve similar to this one.
How does current even flow across the membrane?
In the electrophysiology section we looked at how voltage-gated ion channels influence the kinetics of excitable cells. It is this behaviour that we are closely examining here, by holding the membrane potential at a particular level and observing what happens to ion flow (current) across the membrane.
If we patch-clamp a larger piece of membrane, there will be many ion channels exerting their effect. Technology now exists, however, that allows electrophysiologists to patch-clamp a single ion channel and perform the same experiments. In this way, it is possible to obtain data about individual ion channel types, and characterize their kinetics using I/V curves.
The above figures are all examples of this type of ion channel patch clamping.
Using code to produce these plots
At the risk of losing your trust, it must be admitted that the plots above were not actual biological recordings, but were instead generated by simulating a single ion channel patch-clamp experiment.
Using a NeuroML2 model of an ion channel and a suite of virtual electrophysiology tools (pyNeuroML), you can produce this set of curves, and a similar characterization for any number of ion channel models that exist.
First, make sure you have the latest version of pyNeuroML installed. Jump over to that project’s installation instructions to get up and running.
Now, by doing the set of commands below in your shell, you should be presented with the same set of plots we have been usign in this tutorial.
# grab a sample channel model
wget https://goo.gl/yrAfhn -O Cav1.channel.nml

# analyse it
pynml-channelanalysis -ivCurve Cav1.channel.nml